Motion
Constant acceleration
Acceleration is a vector quantity defined as the change in velocity over time. The unit for acceleration is $ms^{-2}$. Constant acceleration is where the change of speed is at a continuous rate. The equations for calculating acceleration are:
$$ s = at + \frac{1}{2}at^{2} \\ \text{ } \\
s = \frac{(u+v)}{2} t \\ \text{ } \\
v = u + at \\ \text{ } \\
v^{2} = u^{2} + 2as $$
Where:
- $s$ is displacement in metres.
- $u$ is initial velocity in $ms^{-1}$
- $v$ is final velocity in $ms^{-1}$
- $a$ is acceleration in $ms^{-2}$
- $t$ is time in seconds.
Constant velocity
For an object travelling at constant acceleration, there is no change in speed. The velocity can therefore be calculated by:
$$ v = \frac{s}{t} $$
Where $v$ is the velocity, $s$ is the displacement, and $t$ is the time in seconds.
Motion at changing speed
For an object travelling at changing speeds the average speed can be calculated.
$$ \text{Average speed} = \frac{s}{t} $$
Free Fall
The constant acceleration formulas can be applied to falling objects providing that air resistance is ignored. This is because the only force acting on an object is gravity. On Earth this provides a downwards acceleration of 9.81 $ms^{-2}$ and has the symbol $g$.
Speed-time graphs
Constant velocity
A speed-time graph can be used in order to analyse the change in speed over time. For an object travelling at constant speed, a graph such as the one below will be produced:
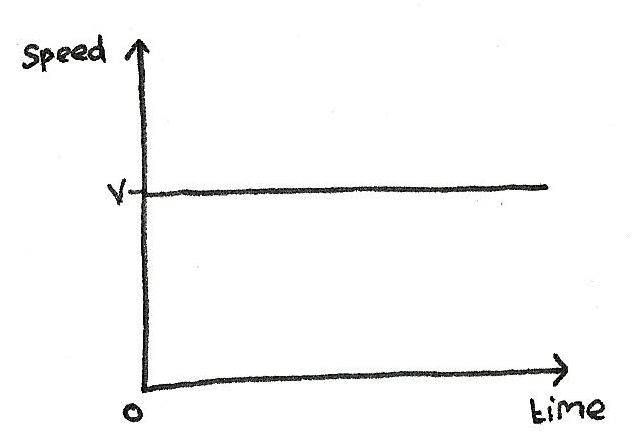
- The area under the curve of any speed-time graph is the distance travelled.
- The gradient is equal to the acceleration. At constant velocity, there is no acceleration so a zero gradient.
Constant acceleration
As the gradient of the curve is the acceleration, for an object with constant acceleration, there will be a constant positive gradient.
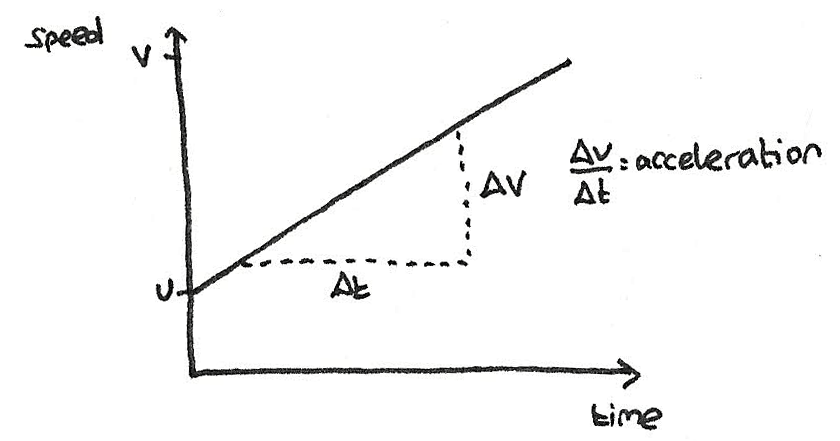
Changing acceleration
With a changing acceleration, the gradient of the graph will change, producing a curved line.
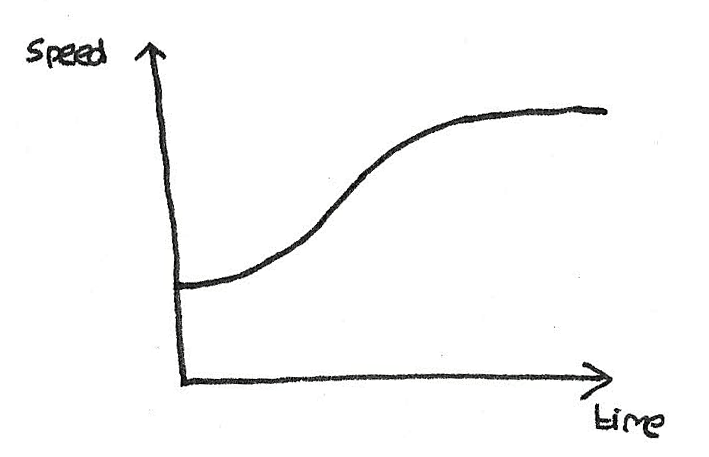
Graphs of object in free fall
If a ball is thrown into the air, the velocity reaches a maximum before decelerating to zero at the peak. After this the opposite occurs and the ball starts to fall downwards, accelerating.
Displacement-time and distance-time graphs
As displacement is the distance away from a certain point, when a ball is thrown, it reaches its maximum displacement at the peak.
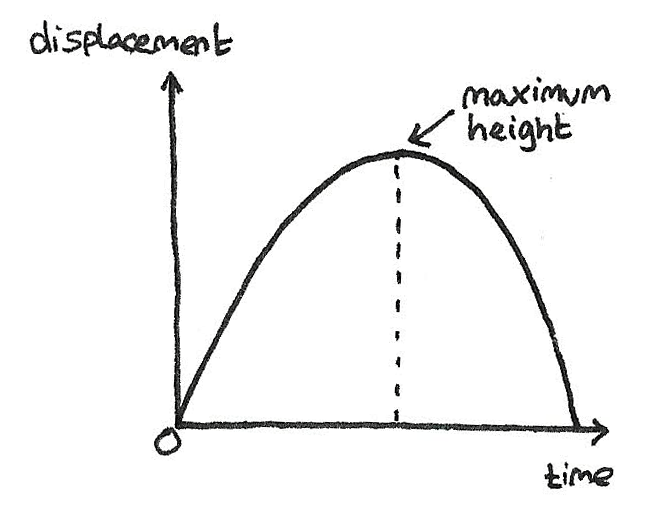
On a distance time graph, the distance is the total distance travelled regardless of the starting position. This therefore produces the following curve.
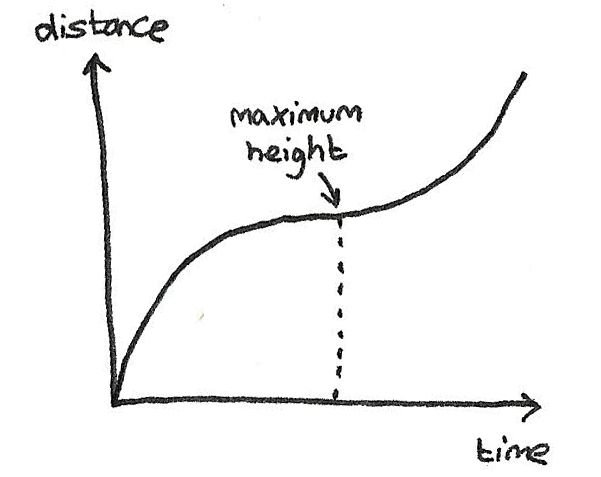
The gradient of the curve is the velocity.
Velocity-time graph
In the same situation of an object being thrown into the air, the velocity time graph will be like the one shown below:
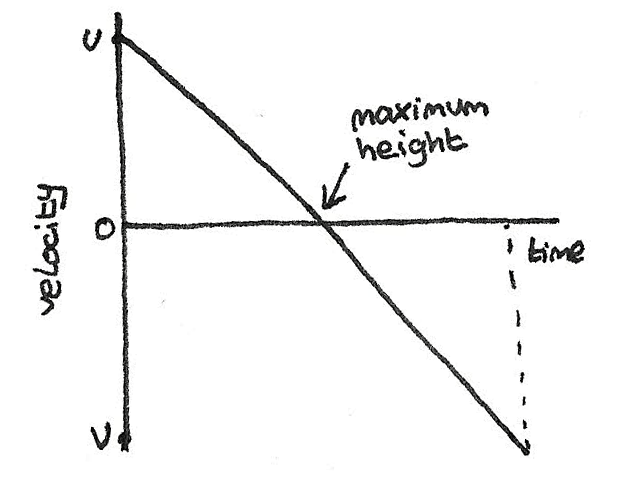
The negative velocity is after the object has reached its peak and is falling back to the ground.
Projectile Motion
A projectile is any object acted upon only through the force of gravity. When in motion, the path forms a parabolic curve.
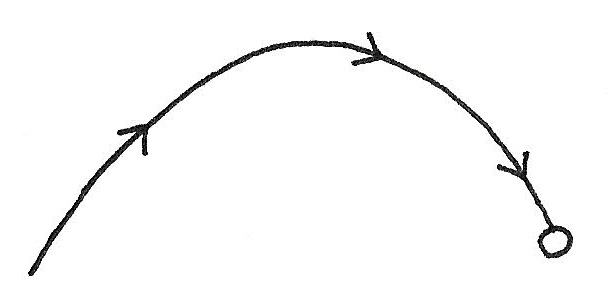
The key principles of projectiles is that:
- The vertical and horizontal components of the object are independent and do not impact each other.
- The vertical acceleration is always equal to $g$.
- The horizontal velocity of the object is constant as the acceleration due to gravity does not have a horizontal component.
This means that any object undergoing projectile motion can be split into horizontal and vertical components:
- Horizontally, the equation is:
$$ s = vt $$
Where $s$ is the displacement, $v$ is the velocity which remains constant and $t$ is the time. - Vertically, the laws of constant acceleration can be used:
$$ s = ut + \frac{1}{2}at^{2} $$
Where $a$ is equal to the acceleration under gravity $9.8ms^{-2}$.